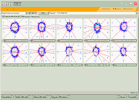
 The program is designed for evaluation of the functional state of the subjects’ organism as compared to that of a practically healthy person.
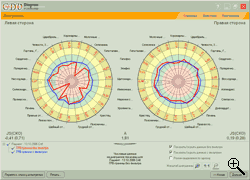
GDV Diagram makes it possible to present results as circular diagrams, assessing organ systems regarding energy excess or energy deficiency. The program also helps to assess the level of emotional susceptibilty of a human by means of comparing parameters of fingertips taken with and without a filter.
Purpose:
- analysis of functional state of the subjects versus a practically healthy person;
- showing the results as circular diagrams divided into sectors related to certain parts of human body (moving the mouse cursor on the plot causes bubble help about the current sector);
- plotting histograms of integral parameters;
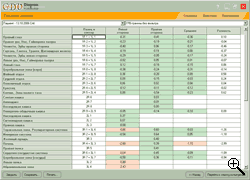
- presentation of data as a table.
Additional possibilities:
- calculation of the subject’s activation level;
- comparison of diagrams for several subjects;
- printing out GDV-images, histograms tables and diagrams.


